Financials
Key Personne in Nos
| Description |
2012-13 |
2013-14 |
2014-15 |
2015-16 |
2016-17 |
2017-18 |
2018-19 |
2019-20 |
2020-21 |
| Authorised Capital |
30 |
30 |
30 |
30 |
30 |
30 |
30 |
30 |
30 |
| Paid up Capital |
30 |
30 |
30 |
30 |
30 |
30 |
30 |
30 |
30 |
| Reserves & Surplus |
751.8 |
846.6 |
893.95 |
942.63 |
998.4 |
1178.8 |
1709.46 |
1977.68 |
2320.7 |
| Turnover |
4435.2 |
4046.4 |
2398.8 |
3067.3 |
5526.2 |
5327 |
8749.41 |
8960.77 |
4147.5 |
| Profit before tax |
254.3 |
166.5 |
120.7 |
196.6 |
357.3 |
339 |
948.89 |
787.18 |
453.6 |
| Profit after tax |
171.5 |
110.1 |
64.7 |
133.5 |
237.6 |
220.1 |
708.64 |
573.55 |
343.1 |
| Current Assets |
1375.6 |
1381.5 |
1181.8 |
1431.7 |
2028.8 |
1775.6 |
2609.71 |
2919.1 |
2370.5 |
| Total Assets |
2532.9 |
2610.5 |
2327.2 |
2671.6 |
3376.8 |
2918.5 |
4425.58 |
5062.26 |
4418.4 |
| Current Liabilities |
1099.5 |
1070.6 |
789 |
868.1 |
1564.7 |
1045.4 |
1710.18 |
2101.24 |
1363.2 |
| Net worth |
781.8 |
876.6 |
923.9 |
972.6 |
1028.4 |
1208.8 |
1739.46 |
2007.68 |
2350.7 |
| Working Capital |
276.1 |
310.9 |
392.8 |
563.6 |
464.1 |
730.3 |
899.54 |
817.88 |
1007.3 |
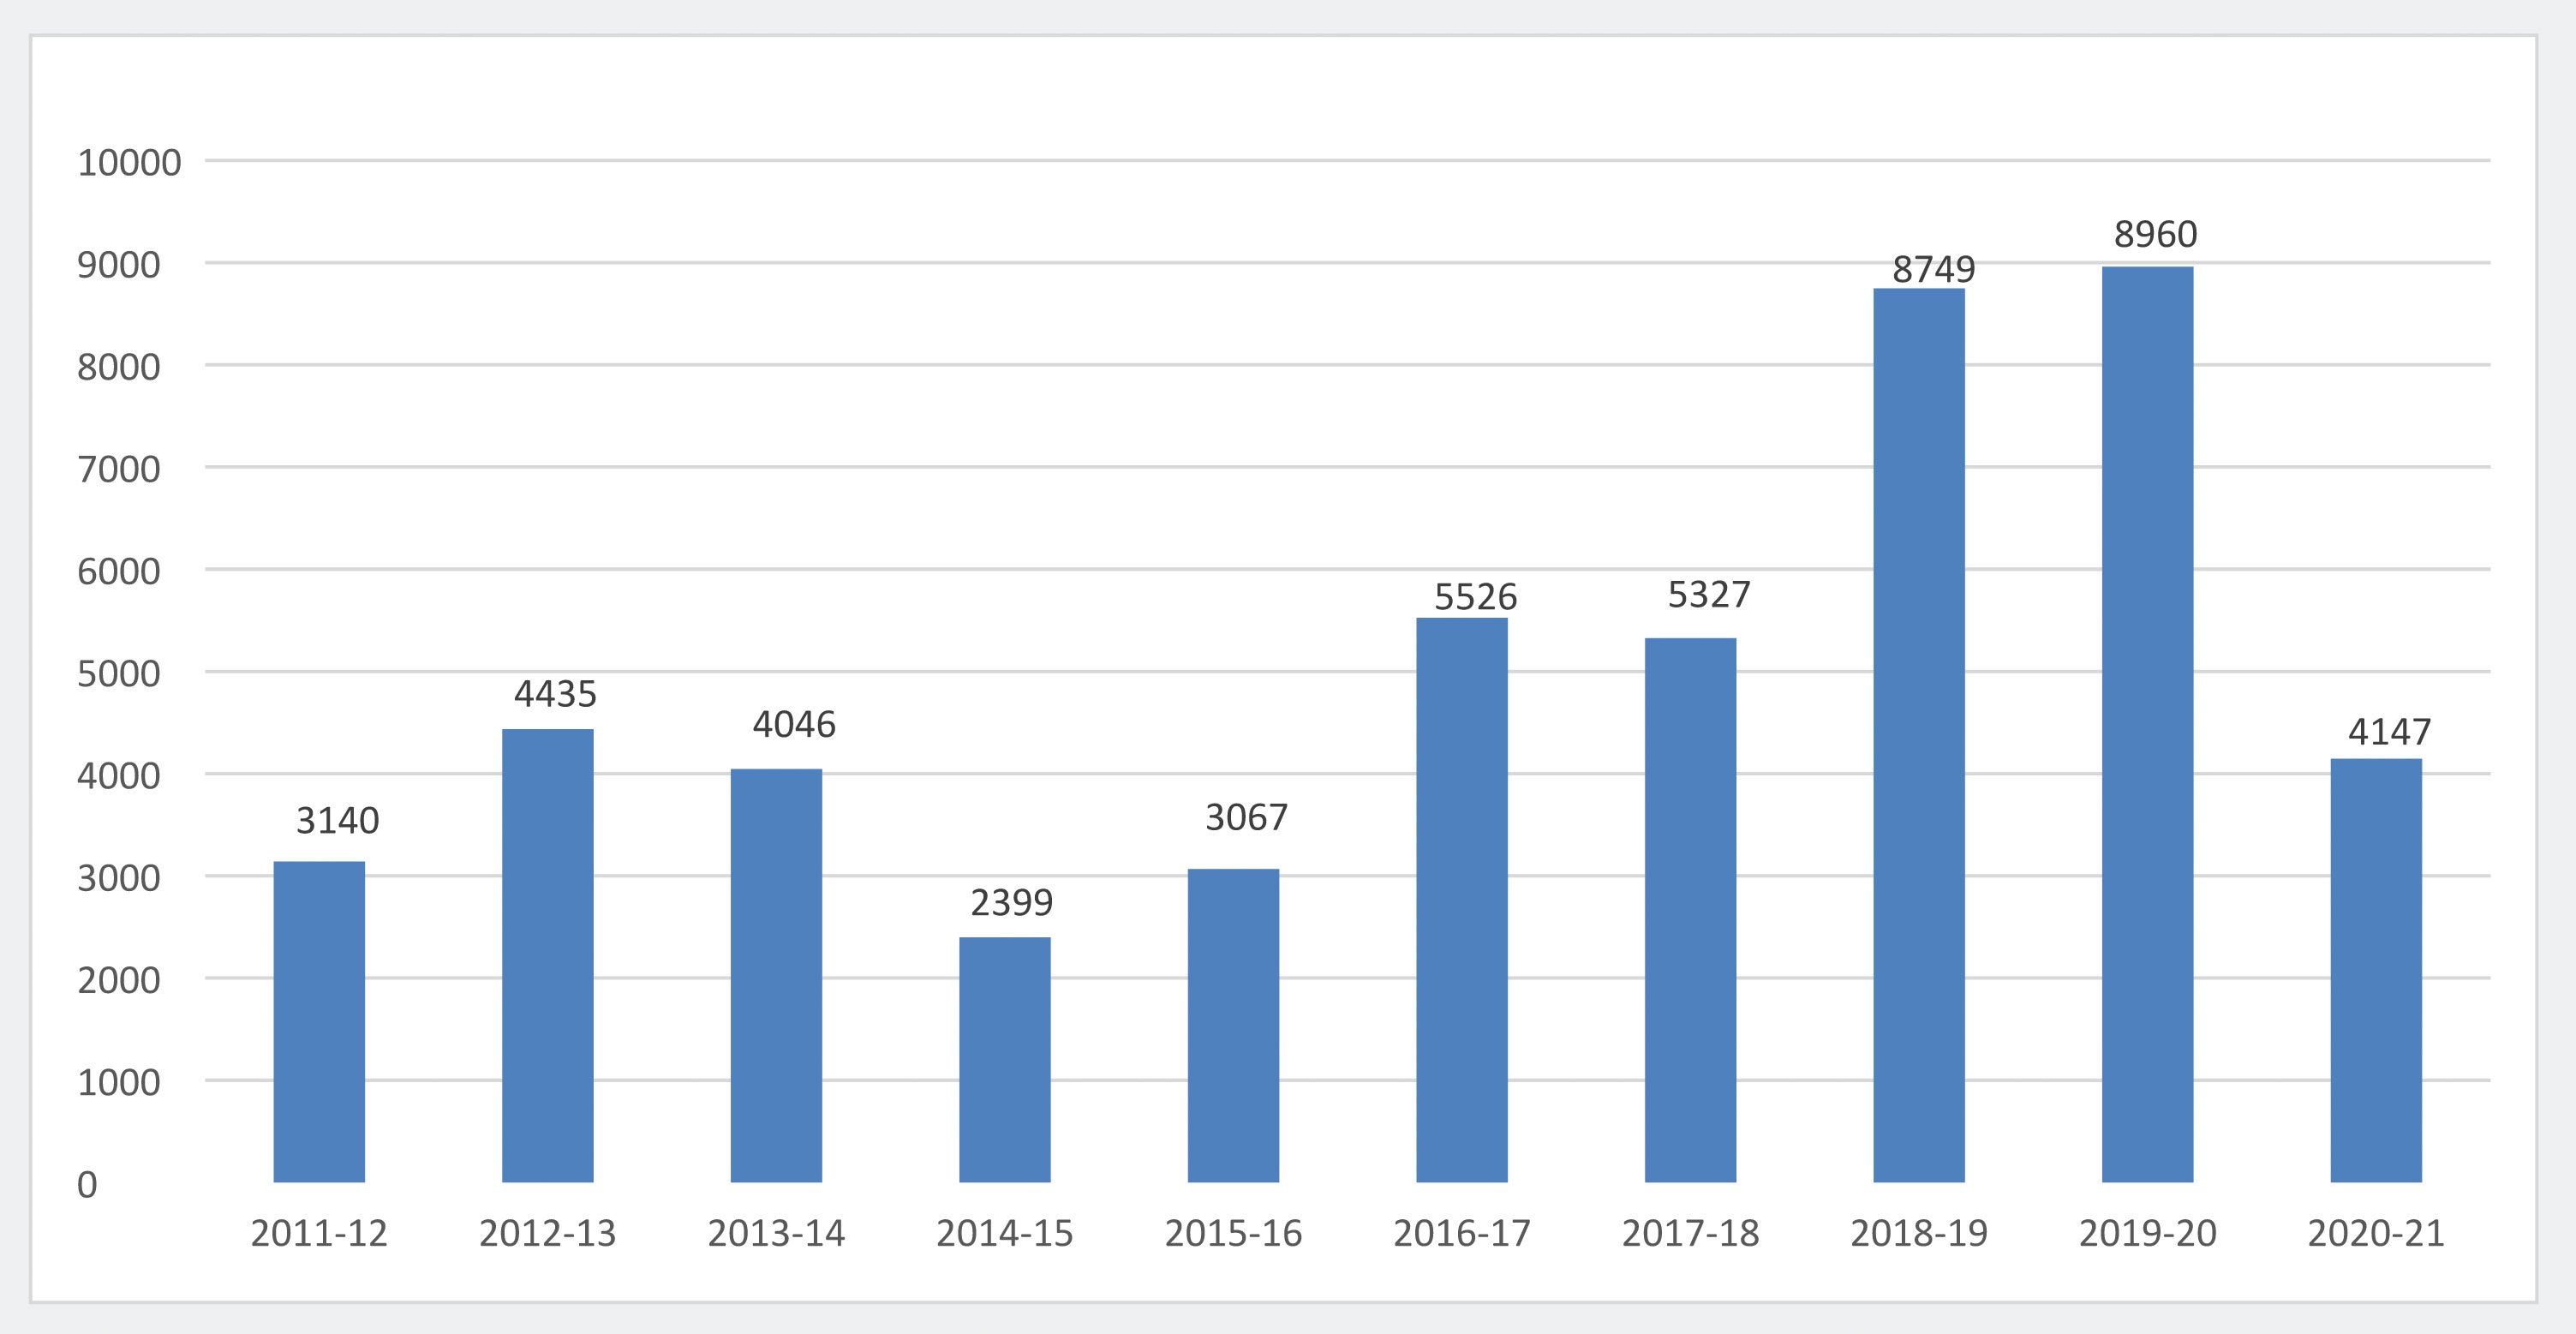
| Turnover |
|
|
|
|
|
|
|
|
|
| Financial Year |
2012-13 |
2013-14 |
2014-15 |
2015-16 |
2016-17 |
2017-18 |
2018-19 |
2019-20 |
2020-21 |
| Rs.In Millions |
4435 |
4046 |
2399 |
3067 |
5526 |
5327 |
8749 |
8961 |
4147.5 |